
Simon User Guide
Monitor![]() Statistics
Statistics
This area of the window provides interesting statistics about the tests. It can display a summary of all tests, of just some, or just one. If no tests are selected in the tests table, the statistics will be an amalgamation of the statistics for all tests. If multiple tests are selected (via  -clicking on them, or
  -clicking a range), the statistics will be a combination of those tests. If only one test is selected, the statistics for just that test will be displayed. This is quite useful in getting an overview of your tests, and focusing on a few or just one of them.
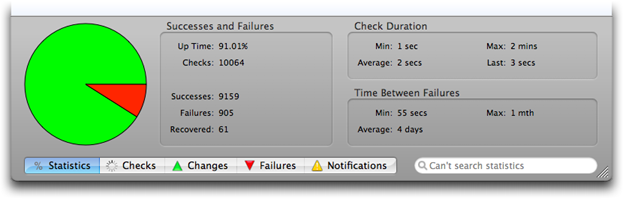
Successes and Failures: This area displays the combined Up Time of the selected tests (or all tests if none selected), the total number of checks performed, the number of successful and failed checks, and the number of times that a test has failed and recovered.
Check Duration: This area displays the shortest, longest, and average (mean) time that the tests took to perform. It also indicates how long the previous test took. These indicate the range and average response time of the server.
Time Between Failures: This area shows the shortest, longest, and average (mean) time between failures. More precisely, it shows the time between recoveries from failures.
Return to the Monitor window page
Go to the User Guide Contents
Return to the main Simon page