
Simon User Guide
Monitor![]() Tests
Tests
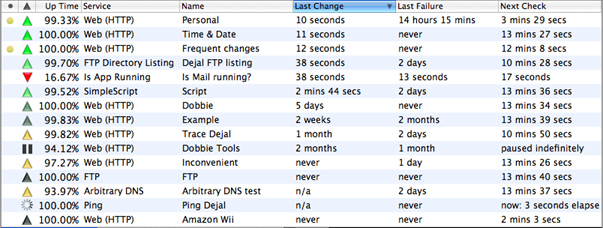
This table lists the tests that you have added. Each of these tests will be checked at the frequency you specify. The columns can be sorted and the sort order toggled by clicking multiple times on a column. The positions and widths of the columns can be changed by dragging the headers, and these changes are remembered.
You can also add or remove columns, and set whether to display each of the date/time columns as absolute dates or relative times, via the the View Options sheet.
Here are the details of each available column, not all of which are included by default:
Unviewed: The left-most column in the table is the Unviewed column. A yellow indicator appears in this column next to tests when a new change is detected, if the Smart Change Detection feature is enabled for the test. This indicator can be used to show that you haven't seen the changes on the test yet. When you next select this test, the indicator is automatically removed, like the unread messages marker in an e-mail application. You can manually toggle the indicator on and off via the Edit![]() Mark as Unviewed command, or the corresponding toolbar button. This column is included by default.
Mark as Unviewed command, or the corresponding toolbar button. This column is included by default.
Status: The next column in the table is the Status column. Lines display an icon indicating whether the test succeeded (e.g. the site was up) or failed (was down) when last checked, indicated by an upwards- or downwards-pointing triangle. The downward triangle is always bright red ( ). But for successful tests, the color of the triangle indicates additional information. If the triangle is a shade of green (
 ), the site has changed recently - specifically more recently than it had an error. If it is a shade of orange (
 ), the test recently failed, but has since recovered - again specifically more recently than any change. The shade hints at how recent the change or error occurred, with it starting off bright green or orange, and eventually fading to gray as time passes. While a test is being checked, the status displays a spinning progress indicator, or if you don't have an internet connection at the time of the check, it shows a flashing lightning bolt until the connection is restored. This column is included by default.
Up Time: This column gives a percentage of successes vs. failures. This is the standard way of indicating how reliable a test is; 100.00% being best, and 0.00% being worst. It is expressed to two decimal places. This column is included by default.
Service: The name of the service used by each test is displayed here. This column is included by default.
Name: This column gives the descriptive name you have chosen for this test. This column is included by default, and can not be removed.
Last Downtime: This column displays the duration of the most recent failure, if any. This column is not included by default.
Last Error: This column shows the error message from the most recent failure, if any. This column is not included by default.
Last Event: This column displays when the most recent change, failure, or recovery occurred. The time is expressed relative to now, in seconds, minutes, hours, days, weeks, months, or years. It is updated every second, or at the frequency specified in the preferences. If you prefer, you can display this time as an absolute date instead of a relative time via the View Options sheet. This column is not included by default.
Last Check: This column displays the date and time of the most recent check. It can also be displayed as a relative time or absolute date. This column is not included by default.
Last Change: This column displays the time that has elapsed since the site last changed. See the Smart Change Detection discussion for information on how the change is detected. The time is expressed relative to now, in seconds, minutes, hours, days, weeks, months, or years. It is updated every second, or at the frequency specified in the preferences. If you prefer, you can display this time as an absolute date instead of a relative time via the View Options sheet. This column is included by default.
Last Failure: This column is similar to the Last Change one, except that it shows how long ago the previous failure occurred when checking this test, if any. This column is included by default.
Last Recovery: This column displays the date and time of the most recent recovery from a failure. It can also be displayed as a relative time or absolute date. This column is not included by default.
Next Check: This column displays the time interval until the test is next checked, again expressed relative to now, or as an absolute date if you prefer. The interval counts down until zero seconds, when the check is performed and the Next Check starts counting down to the subsequent check. It starts counting down from the due time of the previous check, so that the duration of the check doesn't offset the check time. You can reset the check time by using the Check Now function when only one test is selected. This column is included by default.
Last Check Duration: This column shows the length of time that the most recent check took to complete. This column is not included by default.
Last Change Difference: This column displays the text from the most recent Smart Change Detection, if any. This column is not included by default.
Return to the Monitor window page
Go to the User Guide Contents
Return to the main Simon page